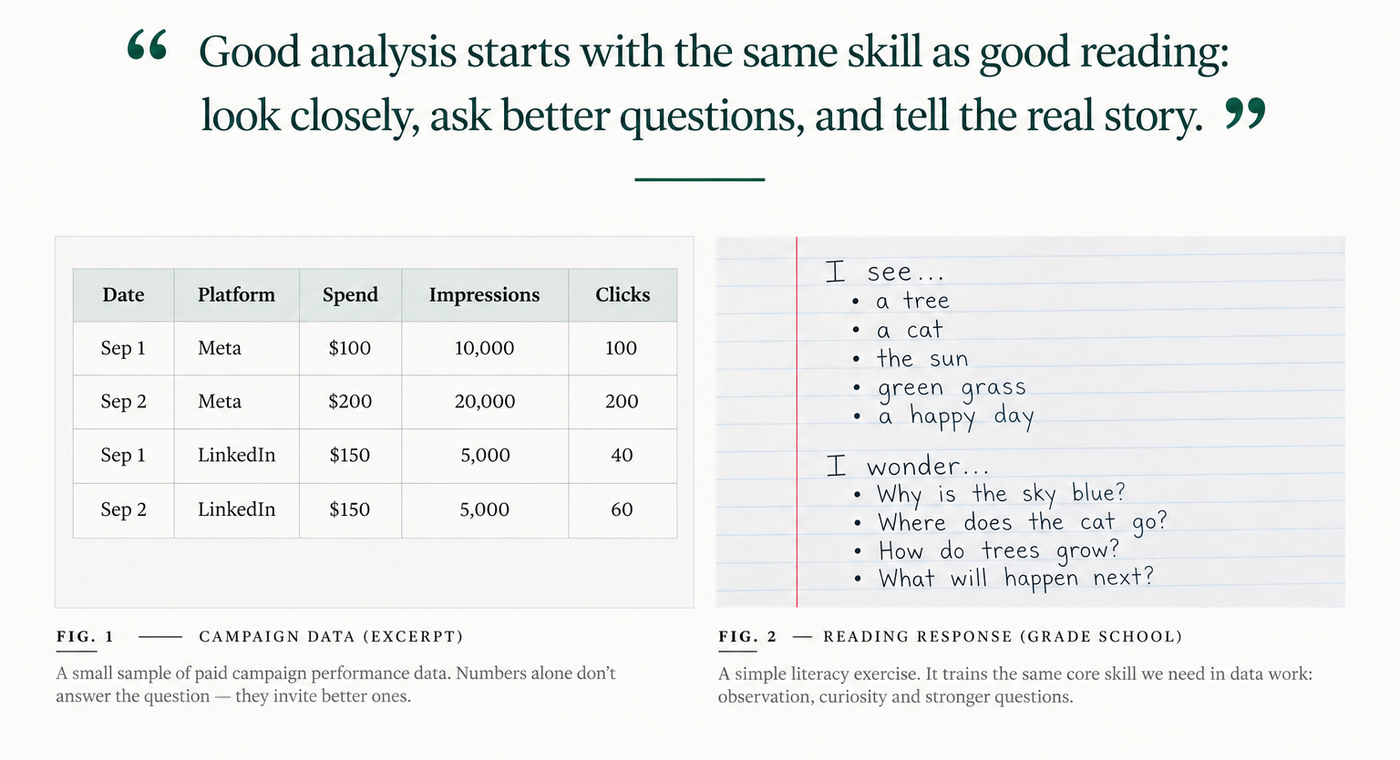
Watching my second grader explain how a story made them feel reminded me why I keep my reporting summaries connected to their source.
I was watching my second grader work through a reading response. The task was not simply to name a feeling the story had evoked. It was to use details from the text to explain why.
What caught my attention was that connection: a response, the evidence behind it, and an explanation of how the two belonged together.
It reminded me of something I do when presenting campaign data.
I often give clients a summary supported by formulas that reference the underlying source data. The summary is easier to read than the original report, but the connection remains. When someone asks where a number came from, I want to be able to show them.
Watching that reading exercise helped me recognize a habit I had carried from one part of my career into another.
I treat raw data like textual evidence.
The habit I brought from literacy education
My master’s degree is in literacy education. Before my work centered on campaign execution, analytics, and reporting, my background was in education.
That experience still shapes how I approach a problem.
When I think about reading, I think about more than arriving at an answer. I think about how someone reached an interpretation, what they noticed, and whether the evidence they selected supports what they are saying.
The connection I saw in my child’s assignment was not about declaring one feeling correct. It was about explaining how something in the text led to that response.
I want the same care in a report.
If I say a tactic performed better, I should be able to explain what “better” means. More clicks? Lower cost? More conversions? Better performance against the actual campaign objective?
Then I need to show what supports the statement.
My education and advertising work may look different on a résumé, but this is one place where they meet: helping someone understand not just the conclusion, but how the evidence supports it.
The summary should leave a way back
When I present data, I am making choices. I select the reporting period, decide which records belong together, choose what to calculate, and determine what deserves attention.
I do not want those choices to become invisible.
A sentence such as “this platform generated most of the clicks” should have a clear path back to the relevant records. That path should explain which clicks, from which campaigns, over which dates.
This is why I prefer a formula-driven summary to a number manually typed into a presentation with no supporting reference.
It is not because every client needs to inspect every row. Most will not.
It is because the explanation should be available when needed—including when I need to check my own work.
The summary is the starting point for understanding, not a replacement for the evidence.
This does not require a complicated workbook
I spend a lot of time thinking about what Excel can do. But this particular habit does not require a complex application, a dashboard, or dozens of interconnected sheets.
Sometimes I just need a clearly defined range and a few formulas.
Consider these four fictional reporting rows. For this example, assume the click counts use a comparable definition and the rows represent the complete period being discussed.
| Date | Platform | Spend | Impressions | Clicks |
|---|---|---|---|---|
| September 1 | Meta | $100 | 10,000 | 100 |
| September 2 | Meta | $200 | 20,000 | 200 |
| September 1 | $150 | 5,000 | 40 | |
| September 2 | $150 | 5,000 | 60 |
I could put these records in an Excel Table named ReportData. Table references let formulas identify columns by name, and those references adjust when data is added to or removed from the table. Microsoft: Using structured references with Excel tables.
On a separate summary sheet, with Meta entered in cell H2, I could use:
=SUMIF(ReportData[Platform],H2,ReportData[Clicks])That adds the clicks from rows whose Platform matches the value in H2. Here, the result is 300. The formula shows both the selection criterion and the values being added. Microsoft: SUMIF function.
For a quick summary of every platform, Excel for Microsoft 365’s GROUPBY can do the grouping and addition in one formula:
=GROUPBY(ReportData[Platform],ReportData[Clicks],SUM,0,0)In this example, the result contains Meta: 300 and LinkedIn: 100. The final two arguments specify that the supplied ranges have no header rows and that the result should omit totals. Microsoft: GROUPBY function.
Or I might want to inspect the individual records, ordered from the largest click count to the smallest:
=SORTBY(ReportData,ReportData[Clicks],-1)SORTBY returns a sorted array. Unlike the grouped summary, this view retains the individual records; it changes their presentation rather than combining them. I would place it outside the source table with room for the result to expand. Microsoft: SORTBY function.
Defined names offer another way to make references readable. I can name a range according to what it contains, then use that name in a formula. The name helps explain the calculation, but I still need to check that its definition points to the intended cells. Microsoft: Define and use names in formulas.
These are small interventions. Their value is not their complexity.
Their value is that the result remains connected to something I can inspect.
The evidence supports a statement—not every statement
From the fictional data above, I can say:
Meta accounted for 300 of the 400 recorded clicks, or 75%, during the selected period.
The arithmetic supports that statement.
It does not, by itself, support:
Meta was the best platform.
“Best” introduces a different question. Perhaps the campaign was judged on qualified leads. Perhaps the audiences had different roles. Perhaps the objective was something these four rows do not measure.
I would need more evidence before making that broader claim.
This is where the literacy connection matters most to me. Finding a detail is one task. Explaining what that detail supports—and where the interpretation goes beyond it—is another.
A formula can help me verify a calculation. It cannot decide whether I have asked the right question.
Evidence should shape the conclusion, not simply decorate it.
A formula is a reference trail, not a guarantee
I think of a source-linked formula as something like a citation: it points back to the material used to produce the result.
But the analogy has limits.
A formula can reference the wrong period. A dataset can contain overlapping exports. A correctly calculated total can still describe an incomplete selection.
Traceability makes those choices easier to examine. It does not make them automatically correct.
When I say “raw data,” I mean the source report I received—not a claim that the export is a perfect account of everything that happened. If I clean names, exclude records, or normalize fields, I want to preserve the original source and make those changes understandable.
I also want the source to match the report being discussed. For a delivered reporting period, I would retain the corresponding source snapshot and calculation context. Otherwise, a workbook updated with new records might explain today’s result while no longer reproducing the number sent last week.
And keeping evidence accessible does not mean distributing every record to everyone. I would share only the supporting data appropriate for that recipient, with any restrictions or exclusions made clear.
The goal is a defensible explanation—not an indiscriminate data dump.
Make the meaning easier to see
I am not arguing against polished presentations or concise client reports. I want those things too.
A summary should save someone time. It should draw attention to the important result and explain why it matters. The supporting data should not force the reader to repeat the entire analysis just to understand the point.
What I resist is the idea that simplifying the presentation requires severing its connection to the source.
I want someone to read the summary, question it, and have a practical way to follow the reasoning backward. That might mean inspecting a formula, reviewing the selected rows, or asking why I included one set of records and excluded another.
That is not a challenge I need to defend against. It is part of making the analysis useful.
Watching my second grader return to the text reminded me of why I work this way. The assignment was not finished at naming a feeling; it asked for the connection between that response and what had been read.
When I present data, I want to be prepared for the equivalent question:
What in the source supports what I am saying?
The goal of reporting is not to make the raw data disappear. It is to make the meaning easier to see while preserving the evidence that supports it.